Efficiency of Solar Panel, LED, Battery, and Charge Controller (2026)
Shinesun's editorial team writes about solar lighting based on our manufacturing, installation, and field-service experience across India.
Every component in a solar light has its own efficiency rating, and the system as a whole behaves like a chain — the final useful light output is the product of all the efficiencies along the path from sun to lit area. Understanding where losses happen helps you choose better fixtures and understand why two "40W" fixtures can perform so differently. Here's the 2026 view of efficiency in a solar lighting system.
The efficiency chain
From sunlight to lit area, energy passes through several conversion stages:
- Sunlight → panel DC output (panel efficiency)
- Panel DC → battery charge (charge controller efficiency)
- Battery charge → battery discharge (battery round-trip efficiency)
- Battery DC → LED light (driver and LED efficiency)
- LED light → useful lit area (optical efficiency)
Each stage has losses. The overall system efficiency is the product of all stages.
Stage 1: Solar panel efficiency
- Monocrystalline 2026 standard — 20-23% of incident sunlight converted to electricity
- Polycrystalline — 15-18%
- Thin film — 8-12%
The remaining 77-92% of sunlight is lost as heat. This isn't a quality issue — it's physics. The job of a quality panel is to get as close to the theoretical limit as possible.
What degrades panel efficiency in practice:
- Dust and dirt (10-25% loss over months without cleaning)
- Partial shading (can disable whole strings)
- High operating temperature (1-2% loss per 10°C above 25°C)
- Aging (0.5%/year linear degradation)
- Low-angle sun (morning/evening) — anti-reflective coating helps
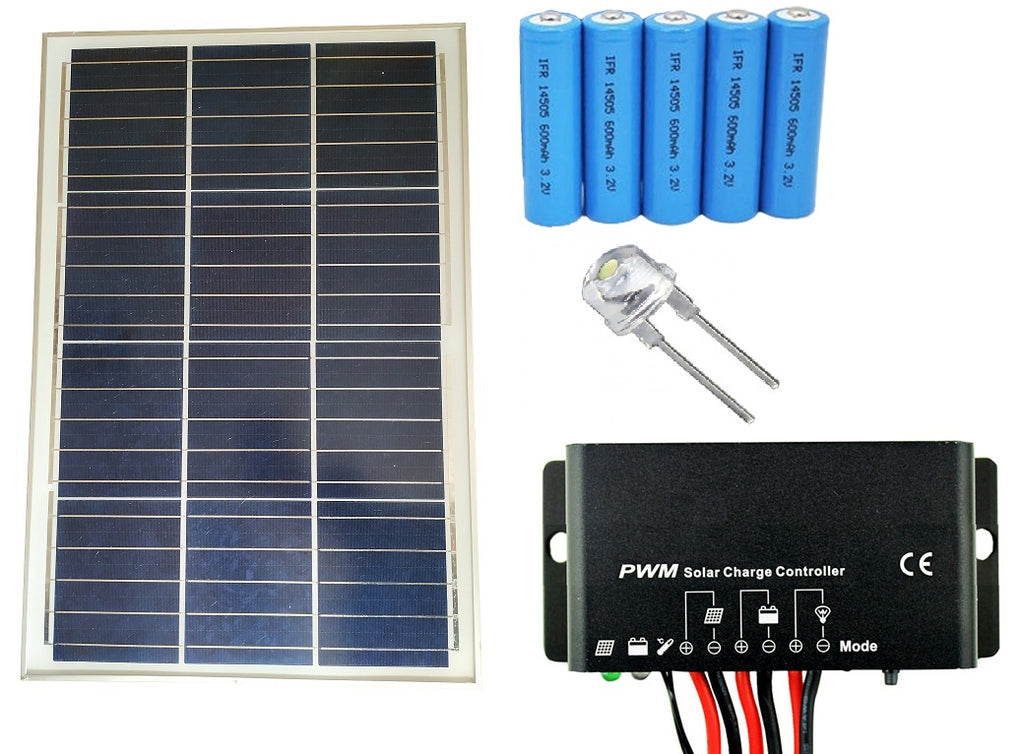
Stage 2: Charge controller efficiency
- MPPT controller — 95-98% efficiency in good conditions; advantage grows in low-light conditions
- PWM controller — 75-80% efficiency typically
MPPT actively tracks the panel's optimum operating point and converts excess voltage to current. PWM is simpler but loses energy when the panel could produce more than the battery directly accepts. On a sunny day, the gap is ~5%. In cloudy conditions, the gap can be 20-30%. See PWM vs MPPT.
Stage 3: Battery round-trip efficiency
Energy stored is not energy retrieved — every battery has losses:
- LiFePO4 — 95-97% round-trip efficiency
- Li-Ion (NMC, LCO) — 92-95%
- Lead-acid — 75-85% (worse with age)
Battery losses appear as heat during both charge and discharge. LiFePO4's high efficiency, combined with its long cycle life, is why it dominates 2026 solar lighting.
Stage 4: LED driver and LED efficiency
The LED driver converts battery DC to the controlled current the LED chips need:
- Quality LED driver — 90-95% efficiency
- LED chip efficacy — 130-160 lm/W for quality chips; 90-110 lm/W for budget
The LED chip itself has a "wall-plug efficiency" of around 50-60% (the rest is heat). The 130-160 lm/W figure already accounts for this — it's the light output per watt of electricity consumed.
Stage 5: Optical efficiency
Not all the LED's output reaches the lit area:
- Lens / diffuser losses — 5-10%
- Mounting angle and beam pattern — fixture aim affects how much light reaches the target ground area
- Direct vs scattered — light scattered upward or sideways is wasted for ground illumination
Quality fixtures with proper optical design lose less here.
System efficiency math
Quality 2026 fixture, sunny day:
- Panel: 22% × Controller: 97% × Battery: 96% × Driver: 94% × Optics: 92% = 17.7% overall system efficiency from incident sunlight to useful ground light
This is good — about as good as the physics allows with current commodity technology.
Budget fixture, same conditions:
- Panel: 16% × Controller: 78% × Battery: 80% × Driver: 85% × Optics: 88% = 7.5% overall system efficiency
That's less than half. Two "40W" fixtures with the same nominal spec but different component quality can deliver dramatically different real-world performance.
Where to focus for the best system
Highest leverage:
- Panel-to-LED ratio at 2-3× — undersized panel is the #1 reason cheap fixtures fail
- MPPT controller (above 30W) — biggest single efficiency boost in marginal conditions
- LiFePO4 battery — efficiency plus longevity
- Branded LED chips — 30-40% more lumens per watt than budget
Important but harder to verify:
- Driver efficiency (rarely published)
- Optical design
- Thermal management (LED chips at 25°C are far more efficient than at 60°C)
Easy to influence post-purchase:
- Panel cleanliness (regular cleaning recovers lost output)
- Mounting orientation (south-facing, correct tilt)
- Shade avoidance (site selection)
Why this matters when buying
Two fixtures sold at "40W" with "100W panel" can deliver dramatically different real-world performance based on the efficiency of each stage. Ask for:
- Panel type and rated efficiency
- Controller type (MPPT or PWM)
- Battery chemistry and rated cycle life
- LED chip manufacturer and rated lumens-per-watt
- System-level rated lumens (not just LED chip rating)
Suppliers who publish these specs are typically the suppliers whose fixtures actually work as advertised.
Shinesun fixture efficiency
Shinesun fixtures use monocrystalline panels, MPPT controllers (above 30W), LiFePO4 batteries, and branded LED chips — designed for full-system efficiency, not just nameplate ratings. For specific component efficiency data on individual fixtures, see product datasheets or contact the team.